
GENERAL
What’s a Rumble Device Designed to Do for Road Safety

If you’ve ever felt your steering wheel shake and heard a deep growl from beneath your tires, you’ve experienced a rumble device in action. Far from being road damage, these are carefully engineered safety features. For anyone wondering what’s a rumble device designed to do, the answer is simple: it’s built to grab a driver’s attention through three channels at once: touch, hearing, and sight, especially when they drift from a safe path.
According to the Federal Highway Administration (FHWA), shoulder rumble strips can cut run-off-road crashes by 20–72%, while centerline versions slash head-on collisions by 44–45%. With benefit cost ratios as high as 54:1, they rank among the most effective and affordable road safety measures in the world.
Quick Answer
A rumble device is designed to warn drivers through vibration, sound, and sometimes visual cues, reducing roadway departure crashes by up to 50%. It’s a low-cost, high-impact safety measure that keeps motorists alert, prevents run-off-road incidents, and saves lives worldwide.
Where and When Was the First Rumble Device Used?
Rumble devices first appeared in 1952 on the Garden State Parkway in New Jersey, aimed at waking up distracted drivers with a vibrating alert under their wheels. These early “singing lanes” scored the pavement’s edge so tires created a whine alerting drivers by sound and feel to drift danger ahead. (Wikipedia)
What’s the Primary Purpose of Rumble Devices on Roads?
For anyone asking what’s a rumble device designed to do, these devices prevent inattentive, drowsy, or distracted driving from turning deadly. They work by creating a sudden, unmistakable alert when a vehicle crosses them, prompting immediate corrective action.
How Do Rumble Strips Alert Drivers?

They trigger three simultaneous signals:
- Tactile: Vibration through steering and seat.
- Audible: A low, sustained rumbling sound.
- Visual: Painted markings or contrast patterns.
This multi-sensory approach ensures even drivers with impaired hearing or vision get the message.
Types of Rumble Strips
- Shoulder Rumble Strips: Placed along road edges to stop drift-offs.
- Centerline Rumble Strips: Separate opposing lanes to prevent head-ons.
- Transverse Rumble Strips: Positioned across lanes before hazards like toll booths or sharp curves.
- Edge Line Rumble Strips: Integrated into lane markings for dual visibility and vibration.
Crash Reduction and Safety Stats
- Shoulder rumble strips: 20–72% fewer run-off-road crashes.
- Centerline rumble strips: 44–45% fewer head-on collisions.
- Combined systems: 20–27% fewer fatal/serious injury crashes.
- Benefit-cost ratio: 5:1 to 54:1 (per FHWA and DOT studies).
Impact on Cyclists and Motorcyclists
While rumble strips improve motorist safety, poorly placed ones can inconvenience or endanger cyclists. Modern guidelines recommend minimum 4-ft clear shoulders for bike safety and smoother “mumble strip” designs to reduce vibration harshness.
Cost-Effectiveness in Developing Countries
For nations with tight infrastructure budgets, rumble devices offer exceptional returns. They require minimal installation time, no power supply, and last for years perfect for high-risk rural corridors.
Design Guidelines and Standards

International standards (FHWA, AASHTO, EU transport agencies) specify:
- Groove depth: 0.5 in (12.7 mm)
- Groove width: 7 in (178 mm)
- Spacing: 12 in (305 mm)
- Noise mitigation: Sinusoidal profiles reduce exterior noise by 2–3 dB.
Myths vs Facts
- Myth: Rumble strips damage tires.
Fact: They cause negligible wear; normal driving is unaffected. - Myth: They’re only for highways.
Fact: Increasingly used on rural and suburban roads.
International Adoption
- United States: 46 of 50 states standardize rumble strips.
- Sweden: 4,700 km of rural roads.
- Australia, Canada, Japan, EU: Widely implemented with localized designs.
Here’s how that section would look, keeping it clean, authoritative, and SEO-friendly while embedding the hyperlinks directly:
Sources
This article’s research is grounded in globally trusted, high-authority sources:
- Federal Highway Administration (FHWA): U.S. government research and crash-reduction data on rumble strips.
- National Cooperative Highway Research Program (NCHRP): Peer-reviewed studies on rumble strip effectiveness and design.
- Wikipedia – Rumble Strip: Historical background, global adoption details, and design evolution.
FAQ’s
Q1: Why are rumble devices placed before sharp bends?
To warn drivers to slow down and prepare for a change in road alignment.
Q2: Do rumble strips work in snow or rain?
Yes, vibration and sound still transmit, though noise may be dampened.
Q3: Can electric cars still feel rumble strips?
Absolutely, the tactile feedback is mechanical, not engine-related.
Q4: Are there quiet versions?
Yes, sinusoidal “mumble strips” reduce exterior noise while maintaining driver alerting.
Q5: Do they harm motorbikes?
No, but riders should cross them at a shallow angle for stability.
About the Author
Ethan K. Rowden is a Highway Safety Specialist with 12 years of experience in roadway design and crash prevention. He has advised transportation agencies in the U.S., Sweden, and Australia on implementing cost-effective rumble device systems that save lives.

The story of the KLEX 2014 curatorial team is not just about organizing an art exhibition. It is about shaping a cultural movement, redefining contemporary expression, and placing Malaysian experimental art on a global map. At the heart of this transformation stood Kok Siew-Wai, a composer, curator, and creative visionary whose influence extended far beyond the stage. His role in KLEX 2014 brought together sound art, experimental music, and cross-disciplinary performance in a way that felt both bold and deeply thoughtful.
In this article, we explore the vision behind the KLEX 2014 curatorial team, the leadership of Kok Siew-Wai, and how this groundbreaking festival reshaped the regional art landscape.
Understanding KLEX and Its Cultural Context
KLEX refers to the Kuala Lumpur Experimental Film, Video & Music Festival, a platform known for pushing creative boundaries. By 2014, it had already established itself as an important space for avant-garde expression in Southeast Asia. The festival encouraged artists to challenge traditional structures and embrace innovation in sound, visuals, and performance.
The 2014 edition stood out because of its strong curatorial direction. The curatorial team aimed to connect local and international artists, building a dialogue between cultures and artistic disciplines. Instead of focusing solely on performance, KLEX 2014 explored the relationship between art, space, and audience engagement.
This cultural context made the role of the curators even more significant. Their decisions shaped the narrative of the entire festival and influenced how experimental art was perceived in Malaysia.
Kok Siew-Wai: The Creative Force Behind the Vision
Kok Siew-Wai is widely respected as a Malaysian composer and sound artist known for his contemporary classical compositions and experimental works. His artistic philosophy blends tradition with innovation, allowing him to move seamlessly between structured composition and improvisational performance.
As part of the KLEX 2014 curatorial team, Kok Siew-Wai brought a refined understanding of sound aesthetics and interdisciplinary collaboration. He did not simply select performers; he crafted an experience. His approach focused on curating works that challenged listeners and invited reflection.
His leadership style emphasized artistic integrity. Instead of following commercial trends, he prioritized conceptual depth and originality. This gave KLEX 2014 a distinct identity rooted in authenticity and creative exploration.
The Curatorial Philosophy of KLEX 2014
The curatorial philosophy of KLEX 2014 revolved around experimentation and dialogue. The team sought to blur boundaries between genres, encouraging collaborations between musicians, filmmakers, and visual artists. This approach reflected a broader global trend in contemporary art where categories become fluid rather than fixed.
Kok Siew-Wai and the curatorial team understood that experimental art can feel inaccessible to new audiences. To address this, they focused on thoughtful programming that balanced complexity with emotional resonance. The goal was not to confuse but to inspire curiosity.
Through careful selection and sequencing of performances, the team created a cohesive narrative. Each performance felt connected to the larger theme of exploration, making the festival more than just a series of independent acts.
Bridging Local and International Artists
One of the most powerful aspects of KLEX 2014 was its ability to bridge local Malaysian talent with international experimental artists. The curatorial team believed that cultural exchange enriches creativity. By inviting global performers, they exposed local audiences to diverse artistic languages.
At the same time, they ensured that Malaysian artists remained central to the program. This balance demonstrated confidence in the region’s creative community. It also helped position Kuala Lumpur as a hub for experimental music and multimedia art.
Kok Siew-Wai’s network within the global contemporary music scene played a crucial role. His connections allowed the festival to attract respected names while maintaining a strong regional focus.
The Role of Sound Art and Contemporary Music
Sound art and contemporary music were core elements of KLEX 2014. Under Kok Siew-Wai’s guidance, the festival highlighted innovative composition techniques, extended instrumental methods, and unconventional performance spaces. These choices reflected his own background as a composer deeply invested in sonic exploration.
The curatorial team emphasized listening as an active experience. Audiences were encouraged to engage deeply with texture, silence, and spatial acoustics. This approach shifted the focus from entertainment to immersion.
By foregrounding experimental sound practices, KLEX 2014 contributed to the broader development of Malaysia’s contemporary classical and avant-garde scene. It helped legitimize genres that often exist on the margins.
Creating Immersive Audience Experiences
KLEX 2014 was not designed as a passive event. The curatorial team carefully considered venue layout, lighting, and performance order to create immersive environments. This holistic approach made each event feel intentional and carefully crafted.
Kok Siew-Wai believed that space influences perception. By experimenting with non-traditional performance venues, the team transformed ordinary locations into artistic landscapes. This added depth to each presentation.
The result was an audience experience that felt intimate yet expansive. Rather than simply watching, attendees became part of a shared exploration of sound and image.
Challenges Faced by the Curatorial Team
Curating an experimental festival is never simple. The KLEX 2014 curatorial team had to balance artistic ambition with logistical realities. Funding, venue limitations, and audience expectations all presented challenges.
Experimental art can sometimes face skepticism. The team had to communicate the value of avant-garde programming to sponsors and stakeholders. Kok Siew-Wai’s reputation and credibility helped build trust and support.
Despite these challenges, the festival maintained its integrity. The curators stayed true to their vision, proving that thoughtful programming can overcome practical obstacles.
Impact on Malaysia’s Experimental Art Scene
The long-term impact of KLEX 2014 remains visible in Malaysia’s growing experimental community. The festival inspired young composers, filmmakers, and multimedia artists to explore unconventional methods. It demonstrated that there is space for risk-taking within the local arts ecosystem.
Kok Siew-Wai’s involvement also elevated the conversation around contemporary composition in Malaysia. His curatorial leadership encouraged deeper engagement with sound research and artistic collaboration.
Many artists who participated in or attended KLEX 2014 went on to pursue international projects. In this way, the festival acted as a catalyst for creative growth beyond its immediate timeframe.
The Legacy of Kok Siew-Wai’s Curatorial Leadership
Kok Siew-Wai’s contribution to the KLEX 2014 curatorial team goes beyond a single event. His leadership exemplified how curators can shape cultural discourse. He approached curation as an art form in itself, blending aesthetic judgment with strategic planning.
His influence helped redefine what a Malaysian experimental festival could look like. Instead of imitating Western models, KLEX 2014 developed its own voice rooted in local identity and global awareness.
Today, his work with the festival is remembered as a turning point. It set new standards for conceptual clarity and artistic ambition within the region.
Why KLEX 2014 Still Matters Today
More than a decade later, KLEX 2014 continues to be referenced in discussions about Southeast Asian contemporary art. Its programming model serves as a case study in effective cultural curation. The balance between experimentation and accessibility remains relevant for modern festivals.
The curatorial framework developed by Kok Siew-Wai and his team offers valuable lessons for emerging curators. It shows that strong vision, combined with collaboration, can transform a festival into a cultural milestone.
As interest in interdisciplinary art grows globally, the principles established during KLEX 2014 feel increasingly forward-thinking. The event was not just timely; it was ahead of its time.
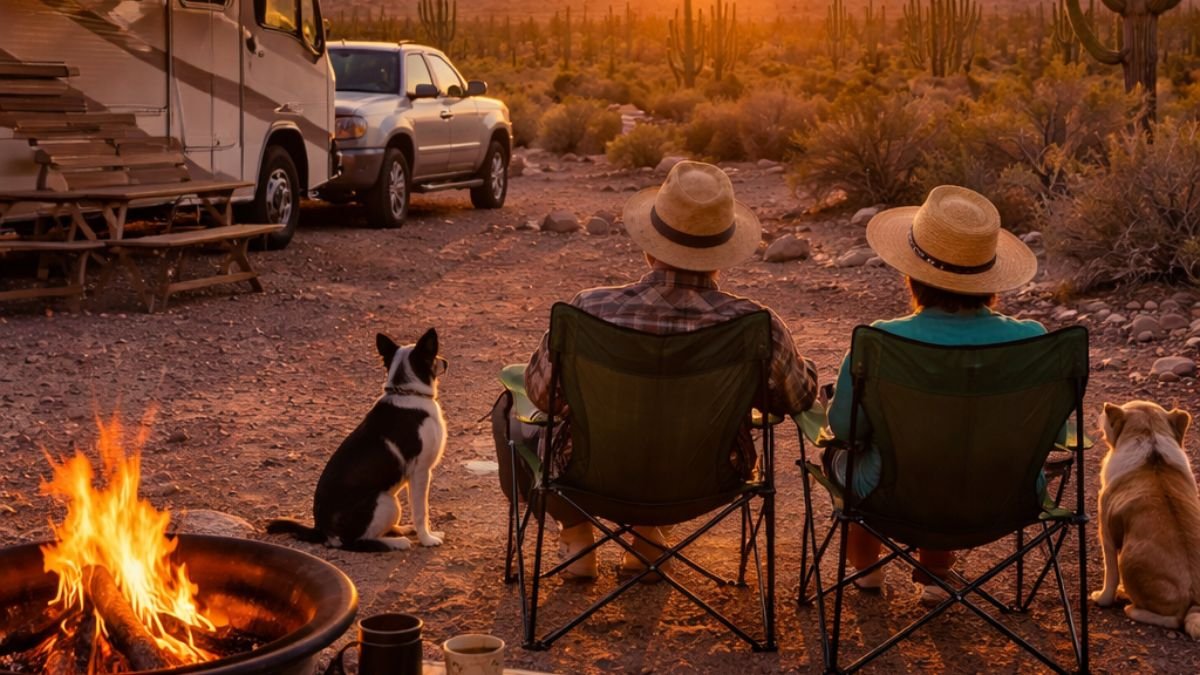
When people search for real-life RV stories filled with honesty, humor, and heartfelt moments, they often come across The Bayfield Bunch. Unlike flashy travel influencers, this blog captures the quiet beauty of life on the road. It is about everyday experiences, small-town charm, retirement adventures, and the simple joys of exploring new places in an RV. Readers are drawn to its genuine storytelling style and thoughtful reflections.
In this article, we’ll explore what makes The Bayfield Bunch special, its background, themes, travel lifestyle, and why it continues to inspire RV enthusiasts and travel lovers alike.
The Story Behind The Bayfield Bunch
The Bayfield Bunch is a personal RV travel blog created by a retired couple who embraced a life of adventure after leaving their traditional routine behind. Originally based near Bayfield, Ontario, the name reflects both their hometown and their close-knit lifestyle. Over time, the blog grew into a chronicle of seasonal migration between Canada and the American Southwest.
The blog is not just about destinations. It is about daily living, emotional reflections, and the reality of life on wheels. The storytelling feels authentic because it captures both good days and challenging ones. Readers connect deeply with this honest approach.
The blog gained attention within the RV community because of its relatable voice. Many retirees considering the RV lifestyle found comfort and inspiration in its posts. It shows that travel is not always glamorous, but it is always meaningful.
A Glimpse into the RV Lifestyle
One of the strongest elements of The Bayfield Bunch is its detailed look into the RV lifestyle. From setting up camp to maintaining a motorhome, the blog offers a realistic view of life on the road. It discusses the daily routines that make RV living manageable and enjoyable.
Seasonal travel is a central theme. The Bayfield Bunch often travels south during winter, exploring warm desert landscapes. Snowbird travel, campground living, and cross-border journeys become part of the rhythm of their life.
The blog also touches on practical aspects like RV maintenance, road safety, and travel planning. These insights are not presented as formal guides but as natural parts of the story. This makes the information feel organic rather than instructional.
Exploring the American Southwest
A significant part of The Bayfield Bunch’s journey unfolds in the American Southwest. The blog frequently highlights destinations in Arizona and other desert regions. The vast landscapes, quiet desert roads, and unique rock formations create a stunning backdrop for their adventures.
Places like Arizona appear often in their travel narratives, especially during winter months. The wide-open desert offers peaceful camping spots and breathtaking sunsets that readers can almost visualize through the writing.
The Southwest travel experience includes small towns, scenic highways, and desert wildlife. Instead of focusing on tourist attractions, the blog emphasizes natural beauty and personal exploration. This slower, reflective style sets it apart from typical travel blogs.
Life Beyond Travel: Personal Reflections
The Bayfield Bunch is more than a travel journal. It is a space for reflection on aging, relationships, loss, and resilience. Personal stories add emotional depth that keeps readers returning.
There are moments of joy, but also moments of hardship. Health challenges, life transitions, and emotional milestones are shared openly. This transparency builds trust and creates a strong connection between writer and reader.
The blog often reads like a conversation with a friend. It does not try to impress. Instead, it invites readers into everyday life. That sense of authenticity is rare in today’s content-driven world.
Photography and Storytelling Style
Visual storytelling plays an important role in The Bayfield Bunch. The blog features photographs of desert sunsets, quiet campsites, dusty trails, and roadside discoveries. These images complement the written narrative and help readers feel present in the moment.
The photography is not overly edited or commercial. It feels real, much like the blog itself. The focus is on capturing atmosphere rather than perfection.
The writing style is calm and reflective. Sentences flow naturally, and the tone remains conversational. This approach enhances the reader experience and keeps the content approachable and warm.
The Appeal to Retirees and RV Enthusiasts
Many readers of The Bayfield Bunch are retirees considering full-time RV living. The blog serves as both inspiration and reassurance. It shows that retirement can be adventurous without being chaotic.
The snowbird lifestyle, where travelers move south for winter, is a recurring theme. The blog highlights how manageable and rewarding this lifestyle can be. It also shows the importance of community within campgrounds and RV parks.
For those researching RV travel blogs, The Bayfield Bunch stands out because it avoids hype. Instead of promising constant excitement, it focuses on simple pleasures and steady exploration.
Challenges of Living on the Road
The Bayfield Bunch does not hide the difficulties of RV life. Mechanical issues, weather challenges, and logistical concerns appear in many posts. This honesty adds credibility.
Life on the road requires flexibility and patience. From border crossings to vehicle repairs, unexpected events can shift plans quickly. The blog shows how adaptability becomes a valuable skill.
By sharing both setbacks and solutions, the blog becomes a learning resource. Readers appreciate that it does not present a fantasy version of RV living but a balanced perspective.
Building an Online Community
Over time, The Bayfield Bunch developed a loyal online following. Readers comment regularly, share personal stories, and connect over shared experiences. This sense of community strengthens the blog’s impact.
The blog also connects with the wider RV blogging network. While it remains personal in tone, it contributes to a broader culture of travel storytelling.
Unlike large commercial travel platforms, The Bayfield Bunch feels intimate. That intimacy creates a lasting reader relationship built on trust and familiarity.
Seasonal Living Between Canada and the U.S.
A defining feature of The Bayfield Bunch is its cross-border lifestyle. Summers are often spent in Canada, while winters unfold in warmer regions of the United States. This seasonal rhythm shapes the blog’s structure.
The Canadian base near Bayfield offers a quieter, rural setting. When winter arrives, the journey south begins. This migration pattern mirrors the lifestyle of many snowbirds.
The transition between landscapes adds variety to the blog’s content. From lush greenery to desert plains, readers experience changing environments through vivid storytelling.
Lessons from The Bayfield Bunch
Beyond travel, the blog teaches valuable life lessons. It highlights the importance of slowing down and appreciating small moments. Simple walks, quiet mornings, and evening sunsets become meaningful experiences.
The Bayfield Bunch demonstrates that adventure does not require luxury. It requires curiosity and openness. This philosophy resonates with readers who crave simplicity.
It also reminds us that retirement can be a beginning rather than an ending. Exploring new places later in life is not only possible but deeply rewarding.
Why The Bayfield Bunch Still Matters Today
In an age dominated by fast-paced content and social media highlight reels, The Bayfield Bunch offers something different. It values depth over speed and reflection over spectacle.
Its blog posts continue to serve as a record of a life well lived on the road. For aspiring RV travelers, it provides inspiration grounded in reality.
The Bayfield Bunch remains relevant because it speaks to universal themes: freedom, companionship, resilience, and the joy of discovery.
Conclusion: A Journey Worth Following
The Bayfield Bunch is more than an RV travel blog. It is a heartfelt chronicle of life on the road, seasonal migration, and personal growth. Through honest storytelling and vivid imagery, it captures the essence of retirement adventure.
Readers are not simply learning about travel destinations. They are witnessing a lifestyle built on curiosity, adaptability, and appreciation for nature. The blog’s lasting appeal lies in its authenticity and emotional depth.
For anyone considering RV living, snowbird travel, or simply seeking inspiring life stories, The Bayfield Bunch remains a meaningful and trustworthy source. It reminds us that the journey matters just as much as the destination.
FAQs
What is The Bayfield Bunch?
The Bayfield Bunch is a personal RV travel blog that shares real-life stories about retirement, road trips, and seasonal living between Canada and the United States.
Who writes The Bayfield Bunch?
The blog was created by a retired couple who document their experiences living and traveling in a motorhome.
Is The Bayfield Bunch still active?
The blog has had periods of activity and quieter phases, but its archived posts remain widely read and appreciated.
What topics does The Bayfield Bunch cover?
It covers RV lifestyle, desert travel, retirement adventures, personal reflections, photography, and snowbird living.
Why is The Bayfield Bunch popular among RV travelers?
Its honest storytelling, practical insights, and emotional depth make it relatable and trustworthy for those interested in RV life.

Why Choosing the Right Lawyer in Perth Matters
Navigating legal matters can be overwhelming, especially when you’re unsure who to trust. In a city as dynamic as Perth, where legal needs range from property disputes to family law and business compliance, having the right legal representation isn’t just helpful—it’s essential. The openhouseperth.net lawyer stands out not only for professional expertise but also for a deep commitment to client-centered service. Unlike large, impersonal firms, this practice prioritizes transparency, accessibility, and genuine care for each individual’s unique situation. Whether you’re buying your first home, facing a contractual disagreement, or planning your estate, aligning with a lawyer who understands both the law and the local context can make all the difference.
Understanding the Openhouseperth.net Legal Approach
The philosophy behind openhouseperth.net lawyer is built on accessibility and clarity. Legal jargon is replaced with plain language, complex processes are simplified, and clients are kept informed at every stage. This approach stems from the belief that legal services should empower—not intimidate—people. The firm operates with an “open house” mindset: welcoming, inclusive, and always ready to listen. This isn’t just a branding choice; it reflects a genuine dedication to community engagement and ethical practice. By fostering long-term relationships rather than one-off transactions, the openhouseperth.net lawyer ensures that clients feel supported well beyond the signing of documents or courtroom appearances.
Areas of Legal Expertise Offered
The openhouseperth.net lawyer provides comprehensive services across several key legal domains. In property law, they assist with conveyancing, title disputes, easements, and lease agreements—critical in Perth’s active real estate market. Family law services include divorce mediation, parenting plans, and property settlements, always with a focus on minimizing emotional strain. For small businesses and entrepreneurs, the firm offers contract drafting, partnership agreements, and regulatory compliance advice tailored to Western Australia’s commercial landscape. Additionally, they handle wills, estates, and enduring powers of attorney, helping families secure their futures with peace of mind. Each practice area is managed with meticulous attention to detail and a proactive strategy to prevent future legal complications.
Local Knowledge, Global Standards
What truly distinguishes the openhouseperth.net lawyer is their fusion of local insight with professional excellence. Perth’s legal environment has its own nuances—zoning laws, native title considerations, state-specific family court procedures—and a lawyer unfamiliar with these can inadvertently delay or jeopardize your case. The team at openhouseperth.net doesn’t just operate in Perth; they live in it. They understand neighborhood dynamics, local council regulations, and the cultural fabric that shapes legal expectations in Western Australia. At the same time, they adhere to national and international best practices, ensuring their advice is not only locally relevant but also legally robust and ethically sound.
Client-Centered Communication and Transparency
One of the most common frustrations people express about legal services is poor communication. The openhouseperth.net lawyer addresses this head-on by establishing clear channels from day one. Clients receive regular updates via their preferred method—email, phone, or in-person meetings—and are never left guessing about costs or timelines. Fee structures are explained upfront with no hidden charges, and flexible payment options are available for those managing tight budgets. This transparency builds trust and reduces anxiety, allowing clients to focus on their lives while their legal matters are handled competently and compassionately.
The Importance of Early Legal Consultation
Many individuals delay seeking legal help, hoping issues will resolve themselves or fearing high costs. Unfortunately, this often leads to more complex—and expensive—problems down the line. The openhouseperth.net lawyer encourages early consultation as a preventative measure. A brief initial discussion can clarify your rights, outline potential risks, and even help you avoid litigation altogether through negotiation or mediation. For example, a quick review of a lease agreement before signing could prevent months of landlord-tenant conflict. Similarly, updating a will after a major life event ensures your wishes are honored without court intervention. Early legal guidance isn’t a luxury—it’s a smart, cost-effective strategy.
Community Involvement and Ethical Commitment
Beyond the courtroom and office, the openhouseperth.net lawyer is deeply embedded in the Perth community. They participate in local events, offer pro bono consultations for vulnerable residents, and collaborate with neighborhood organizations to promote legal literacy. This involvement isn’t performative; it’s a reflection of their core values. They believe that access to justice shouldn’t depend on income or background. Their ethical framework prioritizes integrity, confidentiality, and the highest duty of care—principles that guide every client interaction and legal decision.
How to Get Started with Openhouseperth.net Lawyer
Engaging with the openhouseperth.net lawyer is designed to be simple and stress-free. Prospective clients can reach out through the website’s contact form, call directly, or visit their Perth office during business hours. The first consultation is often offered at a reduced rate or even complimentary for certain matters, allowing you to assess compatibility without financial pressure. During this meeting, you’ll discuss your situation, ask questions, and receive a clear outline of possible next steps. There’s no obligation to proceed—just honest, helpful advice to help you make an informed choice.
Testimonials and Client Success Stories
Real experiences speak louder than promises. Past clients of the openhouseperth.net lawyer frequently highlight the firm’s responsiveness, empathy, and results-oriented approach. One homeowner praised their assistance in resolving a boundary dispute with a neighbor, avoiding costly litigation through skilled negotiation. A small business owner credited the firm with drafting ironclad contracts that prevented future conflicts with partners. Families have expressed gratitude for compassionate support during emotionally taxing separations. These stories underscore a consistent theme: the openhouseperth.net lawyer doesn’t just handle cases—they build relationships and deliver outcomes that align with clients’ personal and practical needs.
Conclusion
In a legal landscape often marked by complexity and distance, the openhouseperth.net lawyer offers a refreshing alternative: expert, approachable, and deeply connected to the Perth community. Their blend of local knowledge, ethical practice, and client-first philosophy ensures that individuals and businesses alike receive not just legal representation, but genuine partnership. Whether you’re facing a pressing legal issue or planning ahead for the future, choosing a lawyer who listens, explains, and acts in your best interest is invaluable. With openhouseperth.net lawyer, you gain more than a legal advisor—you gain a trusted ally rooted in the heart of Perth.
FAQs
What types of legal issues does openhouseperth.net lawyer handle?
The firm specializes in property law, family law, business contracts, wills and estates, and general legal advisory services tailored to individuals and small businesses in Perth.
Is the first consultation free?
While policies may vary by case type, many initial consultations are offered at a reduced or no cost to help you understand your options without financial pressure.
How quickly can I get an appointment?
The team strives to accommodate urgent matters within 24 to 48 hours and offers flexible scheduling for non-urgent consultations.
Do they offer virtual meetings?
Yes, openhouseperth.net lawyer provides phone and video consultations for clients who prefer remote communication or have scheduling constraints.
Are their fees competitive?
Absolutely. The firm emphasizes transparent, fair pricing with clear breakdowns and flexible payment plans to suit different budgets.
-
 GENERAL8 months ago
Robert Hubbell Wikipedia: What’s His 2025 Biography Guide?
-

 EDUCATION10 months ago
Jay Kuo Substack: Unpacking the Voice of Legal Insight
-

 GENERAL10 months ago
Chris Hedges Substack: A Voice of Dissent in the Digital Age
-

 TECHNOLOGY10 months ago
How to Cancel Substack Subscription
-

 ENTERTAINMENT10 months ago
Tyler the Creator Dad Truth
-

 GENERAL10 months ago
Max Azzarello Substack: Inside the Mind of a Radical Truth-Seeker
-

 GENERAL10 months ago
Dream Cake: A Decadent Delight Worth Savoring
-

 EDUCATION10 months ago
Economic Blackout Results: The Financial Domino Effect