EDUCATION
Educated Guess: A Key to Smarter Decision-Making
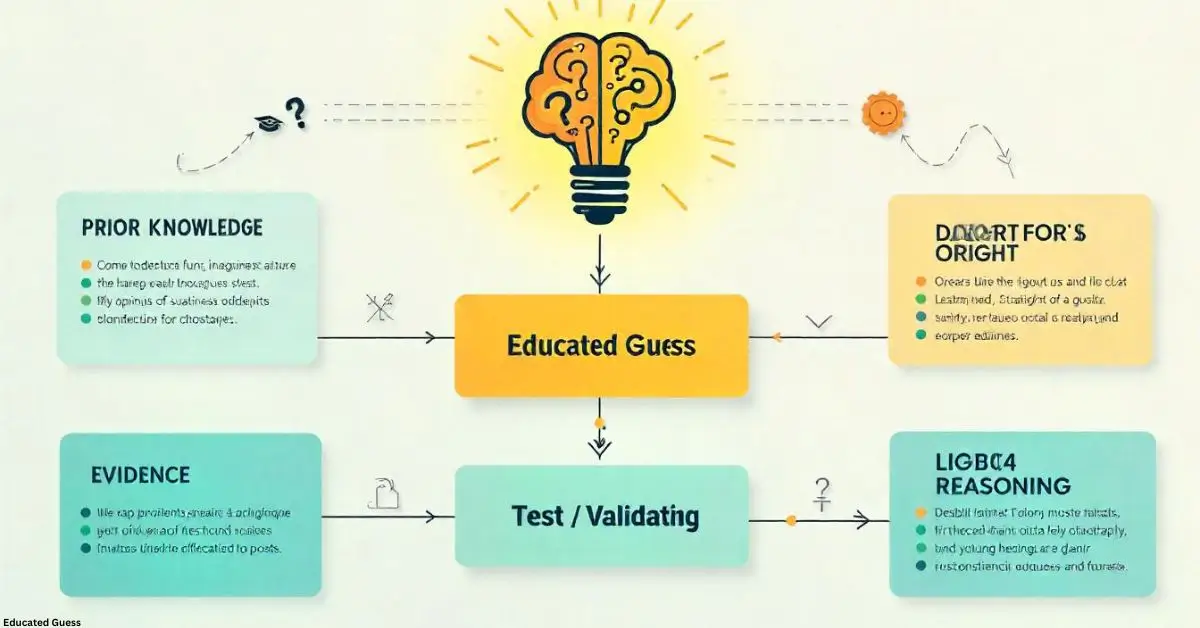
An educated guess is not just a stab in the dark—it’s a thoughtful conclusion drawn from logic, past experience, and contextual understanding. Whether you’re solving problems in the workplace or making day-to-day choices, this technique helps bridge the gap between uncertainty and action.
What Is an Educated Guess?
At its core, an educated guess is a conclusion made using available information, relevant knowledge, and reasonable deduction. It’s more informed than speculation but doesn’t require complete certainty. You’re relying on your understanding, memory, and mental models to draw likely conclusions.
In many situations, total certainty is unrealistic. That’s when logical approximations step in. For example, a teacher might predict a student’s exam score based on prior performance without seeing the test. That’s not random—it’s a reasoned assumption.
Comparison Table: Educated Guess vs Similar Concepts
| Feature | Educated Guess | Estimation | Hypothesis |
| Cost | Minimal | Low to moderate | Moderate to high |
| Efficiency | High | Average | High (but slower to validate) |
| Ease of Use | Easy with experience | Accessible | Requires structured methodology |
| Scalability | Highly adaptable | Variable | Consistent across scientific disciplines |
| Benefits | Accelerates informed decisions | Offers ballpark insights | Drives testing and discovery |
Why the Human Brain Is Wired for Inference
Human beings are wired for pattern recognition and fast conclusions. When presented with incomplete data, our brains activate associative memory to identify what’s most likely based on context. This allows professionals across industries to make insightful calls without complete certainty.
Consider a seasoned software engineer diagnosing a code error. Even without logging every line, they often predict the issue correctly from similar past experiences. That’s practical intelligence in action.
When Educated Guessing Is Most Effective
There are several situations where an informed conclusion is not only appropriate but essential:
- Limited time: When deadlines loom, quick decisions are necessary.
- Partial data: In dynamic environments, all facts may not be available.
- Prior experience: Familiarity with patterns can narrow down outcomes.
- Cost concerns: Testing every scenario may not be financially viable.
From logistics to diagnostics, informed assumptions help streamline problem-solving. A business analyst forecasting next month’s sales with incomplete market data is applying this exact technique.
Top Advantages of Informed Assumptions
Improved Decision-Making Speed
Speed often matters. Whether during emergency response or customer service interactions, time saved equals value delivered. Strategic guessing speeds up resolution time significantly.
Enhances Strategic Thinking
When you rely on informed deduction, you’re training your brain to think critically. It boosts problem-solving capacity over time, preparing you for more complex decision-making scenarios.
Boosts Confidence
Reasoned assumptions create a safety net. With experience, users become more confident in their ability to judge situations even under uncertainty.
Promotes Learning
Each time an informed choice turns out right—or wrong—it teaches something. These mental reps develop stronger intuitive skills over time.
Useful in Multidisciplinary Fields
From education to AI, the ability to infer probable outcomes adds value to professional judgment across a wide spectrum.
Applications of Educated Guessing Across Industries
Healthcare
Medical professionals often form early assessments based on symptoms and experience before confirming through diagnostics. For example, a nurse may suggest probable conditions from a patient’s initial complaints, helping prioritize care.
Business Strategy
Executives frequently make decisions with incomplete information. They estimate market reactions, customer behavior, or competitor moves. These assumptions, when informed, can guide successful strategy.
Engineering
In construction or design, engineers often forecast material performance or estimate load capacity before full-scale simulations. Their training and project history enable accurate evaluations.
Education
Teachers adjust teaching methods based on students’ comprehension levels. Without standardized testing, they still deduce learning gaps from classroom engagement and previous records.
How to Improve the Skill of Educated Guessing
This isn’t purely instinctive—it can be sharpened. Here’s how:
Learn from Patterns
Keep a mental note (or a journal) of what tends to occur in certain conditions. Pattern recognition boosts predictive accuracy.
Eliminate Known Impossibilities
If several answers or options are clearly off-base, rule them out early. This trims down uncertainty and increases precision.
Apply Probability
Weigh the likelihood of outcomes. If one scenario seems 70% likely and another only 10%, lean toward the more probable option.
Reflect and Analyze
After each decision, review whether your reasoning was sound. Feedback loops make the skill stronger.
Use Available Tools
Spreadsheets, flowcharts, or probability models can refine assumptions and guide better predictions.
Challenges and Limitations
Despite their usefulness, logical approximations carry some risk:
- Cognitive biases can distort judgment. Overconfidence and assumptions can cloud objectivity.
- Overreliance may replace research. Guessing should guide—not replace—validation.
- Context errors happen when prior knowledge doesn’t apply to the current case.
Mitigation? Combine wise guesses with verification whenever feasible.
Educated Guessing in AI Systems
Machine learning algorithms operate similarly by predicting outcomes using training data. In e-commerce, for instance, AI might recommend products based on behavioral patterns—akin to how humans guess future preferences using past behavior.
However, AI lacks nuance and human ethics. That’s where human oversight ensures these predictions stay grounded and aligned with user well-being.
Tools That Enhance Reasoned Assumptions
Several aids can refine this cognitive skill:
- Decision Trees: Break complex scenarios into binary paths for structured guessing.
- Probability Charts: Visualize outcomes and likelihoods.
- Data Trends: Support assumption-building with observed behavior patterns.
- Simulations: Role-play or scenario training improves response accuracy.
Such tools combine efficiency with precision, particularly when used repetitively.
Ethical Use of Educated Guessing
Making predictions in sensitive contexts (like finance or healthcare) carries ethical weight. It’s vital to:
- Ensure assumptions are rooted in facts and expertise.
- Communicate that your answer is provisional.
- Be transparent with affected parties.
- Seek confirmation where outcomes significantly affect others.
When applied responsibly, reasoned judgments uphold both effectiveness and ethical standards.
Real-Life Everyday Uses
Think about choosing what to wear based on weather forecasts, picking a grocery line based on past speed, or estimating when traffic will peak. Each of these choices reflects real-world applications of logical inference.
Repeated exposure to such moments helps you form better instincts. Over time, you start identifying subtle cues that others might miss.
How Standardized Testing Encourages Reasoned Guesses
Most standardized exams are designed to reward partial knowledge. Test-takers are often advised to make informed choices instead of leaving blanks. Through process-of-elimination or recognizing familiar terminology, educated choices often result in correct answers even when the full solution isn’t obvious.
In this way, assessment environments push individuals to cultivate analytical reasoning under pressure—a life skill as much as an academic one.
Use Cases in Leadership and Management
Leaders often rely on strategic assumptions to fill gaps in market data or stakeholder preferences. For instance:
- A CEO might infer investor sentiment from recent calls without formal surveys.
- A manager may predict project delays based on subtle shifts in team behavior.
These professional insights help shape policy, budget, and communication plans more effectively than waiting for definitive reports.
Global Cultural Context
In many cultures, making intelligent assumptions is tied to wisdom and expertise. Elders in communities make generational decisions through observation and experience. Farmers often forecast weather patterns, planting schedules, or harvest yields with minimal technological assistance.
These real-world examples show that while the phrase “educated guess” may sound modern, its application is timeless.
Building Intuition through Educated Assumptions
Intuition isn’t mystical—it’s the result of thousands of educated assumptions processed over time. When you act instinctively, you’re often drawing from years of passive learning.
Training this muscle involves:
- Repetition in decision-making.
- Feedback-driven adjustments.
- Conscious reflection after outcomes.
Eventually, choices that once required conscious thought become second nature.
Conclusion
An educated guess is more than a shortcut—it’s a skillful balance of logic, experience, and inference. In work and life, this technique enables faster and smarter decisions when certainty isn’t guaranteed. Used wisely, it strengthens judgment, improves outcomes, and nurtures critical thinking. Whether in a classroom, office, or daily life, mastering this ability is essential for navigating uncertainty with clarity and confidence.
FAQs
What exactly qualifies as an educated guess?
An educated or wise guess is a conclusion based on existing knowledge, experience, and logic. Unlike random assumptions, it’s formed through thoughtful evaluation of available data.
Are wise guesses reliable?
While not always accurate, they are often surprisingly effective—especially when made by experienced individuals. The more informed the guess, the higher its reliability.
Can wise guessing be learned?
Yes, it’s a skill that improves with practice. Repeated exposure to decision-making scenarios enhances pattern recognition and reasoning ability.
Is using this method acceptable in professional environments?
Absolutely. Many industries encourage this approach when time, data, or resources are limited—provided that conclusions are tested or revised as more information becomes available.
How does this method differ from intuition?
Educated guessing involves deliberate analysis of known factors, whereas intuition is more subconscious. Both can overlap, but the former is more evidence-based.
Are there tools that help improve educated guesses?
Yes. Decision trees, spreadsheets, simulation software, and probability charts can all assist in structuring and improving the accuracy of informed conclusions.
EDUCATION
How Has the Boston Population 2024 Changed?
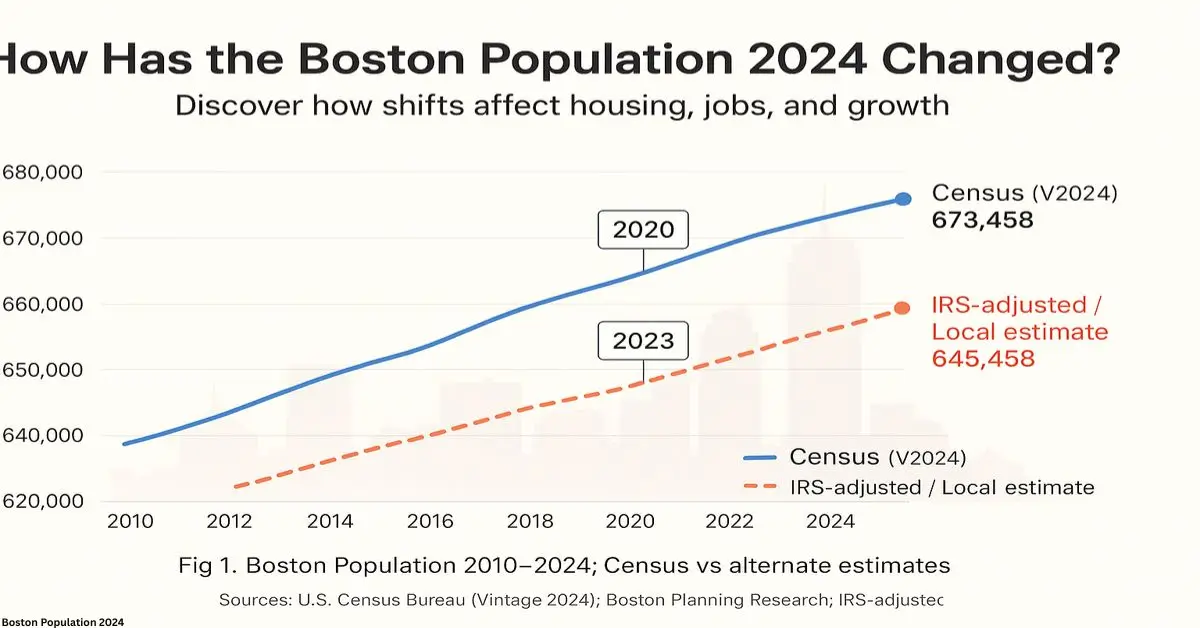
Boston population 2024 is more than just a statistic, it drives housing markets, business plans, and city policy. Whether you’re planning a project, moving here, or studying city growth, the latest numbers tell a deeper story.
Quick Answer: Boston’s 2024 Population
Boston’s population in 2024 is 673,458 according to the U.S. Census Bureau’s latest estimates. The Boston metro area has 5,025,517 residents, making it the 11th largest in the U.S.
What Counts as “Boston”?
Boston city refers to the official city limits. The Boston metro area includes nearby cities and towns where people live, work, and commute together. The Census is the official national count every 10 years, while annual estimates track population changes in between.
City vs. Metro: The 2024 Picture
- City population: 673,458 (down 0.3% from 2020’s 675,647)
- Metro area population: 5,025,517 (up 1.2% from 2023)
- Population density: 13,841 per sq. mile over 48.4 sq. miles
- Rank: 25th largest U.S. city, 11th largest metro
Growth Trends Since 1950
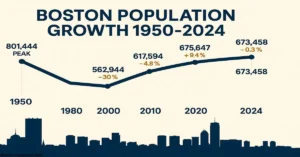
- 1950: 801,444 (historical peak)
- 1980: 562,994 (30% drop from 1950)
- 2000: 589,141
- 2010: 617,594 (+4.8%)
- 2020: 675,647 (+9.4%)
- 2024: 673,458 (-0.3%)
The city’s population dipped slightly since 2020, but the metro area grew faster than any in the Northeast or Midwest from 2023 to 2024.
What’s Driving the Numbers?
International migration is the key driver of Boston’s population growth. In 2024, Massachusetts gained 90,217 net international migrants but lost 27,480 domestic residents, meaning foreign-born arrivals offset local departures.
Boston’s Demographic Makeup (2024 Estimates)
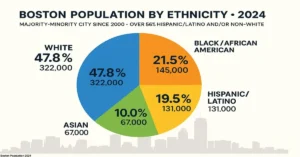
| Category | % of Population | Approx. Number |
| White | 47.8% | 322,000 |
| Black/African American | 21.5% | 145,000 |
| Hispanic/Latino | 19.5% | 131,000 |
| Asian | 10.0% | 67,000 |
Majority-minority since 2000: Over 56% of residents are Hispanic/Latino and/or non-White.
Neighborhood Variations
- East Boston: Nearly 50% foreign-born
- South Boston: 76.9% White
- Highest growth areas: Charlestown, South Boston Waterfront, Allston
- Student influence: 159,000+ enrolled in city institutions, making counts tricky
Controversies in the Count
City officials claim the 2020 Census undercounted Boston by 25,000+ people due to pandemic disruptions and difficulty counting mobile young adults. Researchers suggest the true 2020 population was closer to 699,893.
Expert Voices:
- Robert L. Santos, U.S. Census Bureau Director: “The quality of the 2020 Census count is consistent with recent censuses,” but noted undercount issues among certain groups.
- Michelle Wu, Boston Mayor: “Our population was undercounted…this impacts funding and representation.”
- Peter Ciurczak, Boston Indicators: “Immigration has been saving our butts.”
Boston vs. Other Cities in 2024
| City | 2024 Population | Growth Rate 2023–2024 |
| Boston, MA | 673,458 | -0.3% |
| New York, NY | 8,335,897 | +0.2% |
| Philadelphia, PA | 1,550,540 | -0.1% |
| Austin, TX | 983,350 | +2.1% |
Boston’s city growth lags Sun Belt metros but outpaces many Northeast peers in metro growth.
Why This Matters for Housing & Business
- Real estate: Slight city shrinkage, but strong metro growth = suburban demand.
- Policy: Immigration trends will shape the future labor force.
- Infrastructure: Growth strains roads, schools, and utilities.
FAQ’s
Q1: What is Boston population 2024?
Boston has 673,458 people; metro area 5,025,517.
Q2: Is Boston’s population increasing or decreasing?
The city declined 0.3% from 2020; the metro grew 1.2% from 2023 to 2024.
Q3: What drives Boston’s population growth?
Primarily international migration; domestic migration is negative.
Q4: How diverse is Boston?
Over 56% of residents are Hispanic/Latino and/or non-White.
Q5: How does Boston compare to other cities?
It’s the 25th largest U.S. city but ranks 11th in metro size.
Sources:
- U.S. Census Bureau, 2024 Estimates
- Boston Planning and Development Agency
- Boston Indicators Research
EDUCATION
Best States for Teacher Pay vs Cost of Living (2025)
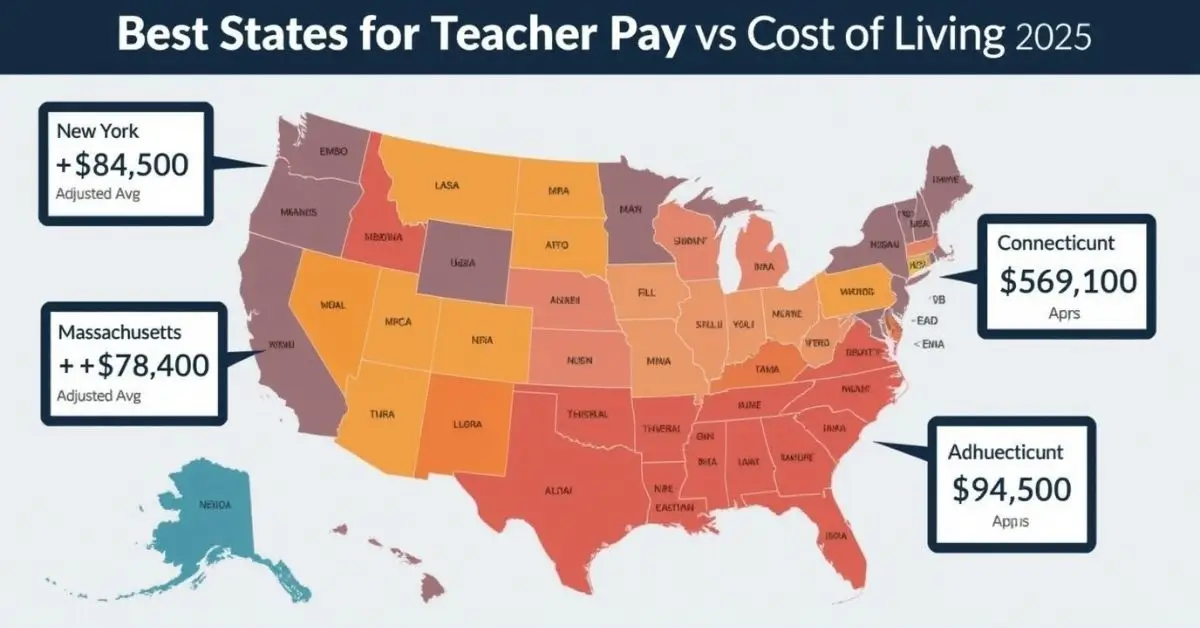
If you’re a teacher, tutor, education student, union leader, or school admin, you’ve probably asked: Where can I earn well and still afford to live comfortably? Great pay doesn’t always mean great value—especially when rent, groceries, and gas eat it all up. We’ve ranked the best states for teacher pay vs cost of living so you can see where your salary works smarter, not harder.
Short Answer
The best states for teacher pay vs cost of living in 2025 are Missouri, Arkansas, North Dakota, Mississippi, and Indiana. These states offer high teacher salaries relative to low housing, food, and utility costs. Teachers in these states keep more of what they earn—and live better on less.
Why Salary Alone Doesn’t Tell the Whole Story
A big paycheck sounds great. But if you’re paying $2,500/month in rent, that $60k salary quickly vanishes.
That’s why we looked at salary-to-cost-of-living ratios, not just raw wages.
Here’s what we analyzed:
- Average teacher salary by state
- 2025 cost of living index
- Adjusted income (real take-home value)
- State benefits, housing affordability, and teacher retention rates
(Source: National Education Association (NEA), U.S. Bureau of Labor Statistics (BLS), and WalletHub cost-of-living data.)
Top 25 States for Teacher Pay vs Cost of Living (2025)
| Rank | State | Avg Teacher Salary | Cost of Living Index | Value Score |
| 1 | Missouri | $52,300 | 87.4 | High |
| 2 | Mississippi | $51,100 | 85.0 | High |
| 3 | Arkansas | $53,200 | 86.7 | High |
| 4 | West Virginia | $52,600 | 87.9 | High |
| 5 | Indiana | $56,900 | 89.1 | High |
| 6 | Iowa | $57,800 | 90.3 | High |
| 7 | Ohio | $59,000 | 91.2 | High |
| 8 | Kentucky | $55,500 | 89.7 | High |
| 9 | Oklahoma | $54,800 | 88.3 | High |
| 10 | North Dakota | $58,200 | 92.1 | Medium |
| 11 | South Dakota | $53,700 | 89.6 | Medium |
| 12 | Louisiana | $54,000 | 90.8 | Medium |
| 13 | Kansas | $55,900 | 91.7 | Medium |
| 14 | Alabama | $56,000 | 92.2 | Medium |
| 15 | Georgia | $58,900 | 93.1 | Medium |
| 16 | Texas | $59,100 | 94.2 | Medium |
| 17 | Tennessee | $57,000 | 92.9 | Medium |
| 18 | New Mexico | $60,300 | 95.4 | Medium |
| 19 | Michigan | $62,000 | 96.3 | Medium |
| 20 | Pennsylvania | $64,200 | 98.5 | Medium |
| 21 | North Carolina | $58,400 | 95.1 | Medium |
| 22 | Florida | $57,800 | 96.7 | Medium |
| 23 | Wisconsin | $63,000 | 98.1 | Medium |
| 24 | Arizona | $60,100 | 97.5 | Medium |
| 25 | Minnesota | $65,000 | 99.2 | Medium |
Top 25 States Complete Details
1. Missouri
- Adjusted Salary: High due to low cost of living (COL index: 87.4)
- Housing Costs: Rent is affordable, even in larger cities
- Teacher Retention: Strong teacher community and pension support
- State Incentives: Relocation aid available in rural districts
- Cost Stability: COL has remained stable over the past three years
2. Mississippi
- Adjusted Salary: High relative to extremely low living costs
- Housing Costs: Among the most affordable home prices in the U.S.
- Teacher Retention: Improving with new state-led reforms
- State Incentives: Tax relief and housing help for educators
- Cost Stability: Very low inflation from 2023 to 2025
3. Arkansas
- Adjusted Salary: Offers high value with moderate base pay
- Housing Costs: Consistently below national average
- Teacher Retention: High teacher loyalty in rural communities
- State Incentives: Signing bonuses and student loan forgiveness
- Cost Stability: Minor fluctuations in utilities
4. West Virginia
- Adjusted Salary: Modest pay offset by low living costs
- Housing Costs: Very affordable, especially in small towns
- Teacher Retention: Strong in districts offering local support
- State Incentives: Grants for teachers in underserved schools
- Cost Stability: Largely stable since 2022
5. Indiana
- Adjusted Salary: High when adjusted for COL
- Housing Costs: Competitive in suburban and exurban areas
- Teacher Retention: Better than neighboring states
- State Incentives: Support for continuing education
- Cost Stability: Minor rise in housing; other costs flat
6. Iowa
- Adjusted Salary: Reliable and balanced
- Housing Costs: Home prices remain highly affordable
- Teacher Retention: Strong support systems for educators
- State Incentives: Rural teacher grants and professional development
- Cost Stability: Stable inflation rates
7. Ohio
- Adjusted Salary: Strong, especially in mid-size cities
- Housing Costs: Rent-to-income ratio is favorable
- Teacher Retention: High satisfaction in suburban districts
- State Incentives: Pension-friendly retirement plans
- Cost Stability: Costs have remained steady for three years
8. Kentucky
- Adjusted Salary: Solid, especially for early-career teachers
- Housing Costs: Easy homeownership for educators
- Teacher Retention: High due to teacher mentorship initiatives
- State Incentives: Bonuses for working in high-need districts
- Cost Stability: No major inflation across categories
9. Oklahoma
- Adjusted Salary: Strong value after adjusting for COL
- Housing Costs: Low across most counties
- Teacher Retention: Upward trend due to state reforms
- State Incentives: Extra pay for STEM and special ed teachers
- Cost Stability: Predictable and low
10. North Dakota
- Adjusted Salary: High, aided by low tax burden
- Housing Costs: Modest and widely accessible
- Teacher Retention: Strong retention in rural towns
- State Incentives: State-provided housing support
- Cost Stability: Minimal inflation since 2023
11. South Dakota
- Adjusted Salary: Competitive due to low living costs
- Housing Costs: Among the cheapest in the Midwest
- Teacher Retention: High in stable, small school districts
- State Incentives: Performance bonuses and increased funding
- Cost Stability: Costs for utilities and healthcare are stable
12. Louisiana
- Adjusted Salary: Competitive in most regions
- Housing Costs: Cost-effective outside of major cities
- Teacher Retention: Improving with state-union collaboration
- State Incentives: Tiered rural bonuses and retention stipends
- Cost Stability: Minor cost increases in select metros
13. Kansas
- Adjusted Salary: Strong, especially for new teachers
- Housing Costs: Affordable across urban and rural areas
- Teacher Retention: High due to career development pathways
- State Incentives: Bonus pay for STEM and bilingual educators
- Cost Stability: Consistent across all major needs
14. Alabama
- Adjusted Salary: Higher than regional average
- Housing Costs: Homeownership is attainable statewide
- Teacher Retention: Growing due to support networks
- State Incentives: Student loan forgiveness in underserved districts
- Cost Stability: Low inflation in essentials
15. Georgia
- Adjusted Salary: Very good outside of Atlanta metro
- Housing Costs: Accessible in inland and mountain areas
- Teacher Retention: Strengthening through investment in PD
- State Incentives: Down payment assistance programs
- Cost Stability: Relatively stable across key categories
16. Texas
- Adjusted Salary: High in rural and non-metro regions
- Housing Costs: Variable, best in inland cities
- Teacher Retention: Depends on local district funding
- State Incentives: Relocation incentives and classroom grants
- Cost Stability: Stable inland, higher fluctuation on coasts
17. Tennessee
- Adjusted Salary: Competitive in most regions
- Housing Costs: Affordable outside of Nashville
- Teacher Retention: Increased teacher engagement
- State Incentives: Loan payoff support for new teachers
- Cost Stability: Stable in energy and housing
18. New Mexico
- Adjusted Salary: Competitive with cost savings
- Housing Costs: Affordable in both cities and towns
- Teacher Retention: Growing due to housing programs
- State Incentives: Educator housing communities funded by the state
- Cost Stability: Low utility and grocery inflation
19. Michigan
- Adjusted Salary: High in metro and suburban areas
- Housing Costs: Very affordable outside Detroit
- Teacher Retention: Strong union presence supports long tenure
- State Incentives: Tuition and professional development assistance
- Cost Stability: Moderate and predictable
20. Pennsylvania
- Adjusted Salary: Very strong in smaller districts
- Housing Costs: Lower than average outside major cities
- Teacher Retention: Boosted by pension protections
- State Incentives: Rural educator stipends
- Cost Stability: Controlled inflation across the board
21. North Carolina
- Adjusted Salary: Improving steadily
- Housing Costs: Affordable in non-urban counties
- Teacher Retention: Better with mentorship and incentives
- State Incentives: Tuition aid and scholarship for teacher students
- Cost Stability: Stable outside coastal regions
22. Florida
- Adjusted Salary: Uneven, better in central regions
- Housing Costs: High on coasts, fair inland
- Teacher Retention: Improving in districts with strong support
- State Incentives: Bonuses for high-need subjects
- Cost Stability: Housing cost volatility remains an issue
23. Wisconsin
- Adjusted Salary: High with pension benefits
- Housing Costs: Moderate in urban areas, low elsewhere
- Teacher Retention: Strong in public school systems
- State Incentives: Long-term benefits for career teachers
- Cost Stability: Predictable costs across the board
24. Nebraska
- Adjusted Salary: Balanced for urban and rural educators
- Housing Costs: Highly affordable
- Teacher Retention: Supported by strong professional autonomy
- State Incentives: Access to teacher-specific housing funds
- Cost Stability: One of the most stable markets in the U.S.
25. Nevada
- Adjusted Salary: Strong in Clark and Washoe counties
- Housing Costs: Rising slightly, still manageable
- Teacher Retention: Growing due to district-level support
- State Incentives: Bonuses for underserved schools
- Cost Stability: Mild utility and housing increase only
States with High Pay but Low Value
Some states boast big salaries but struggle with affordability:
- California: Avg salary is over $85k, but COL index is 143.4.
- New York: Salary is strong but rent and taxes erase value.
- Hawaii: High wages, but highest COL index in America.
Teachers in these states often report paycheck-to-paycheck living.
Pro Tips for Teachers Thinking About Relocation
- Use Teacher Certification Reciprocity to switch states easily
- Look for relocation bonuses or signing incentives
- Research pension portability across state lines
- Join Facebook groups for local teacher housing tips
Final Thoughts: Go Where the Value Lives
A big salary is great. But a smart salary one that buys more life for less money is even better.
Don’t just follow the paycheck. Follow the value.
Whether you’re a teacher, policy analyst, or union leader, knowing which states offer the best return on your labor is key to long-term success.
FAQ’s
Which are the best states for teacher pay vs cost of living ?
Missouri, Arkansas, and Mississippi lead in pay vs expenses.
How much do teachers make in affordable states?
Usually between $50,000–$58,000, which stretches further due to low costs.
Is it worth relocating as a teacher in 2025?
Yes, especially to states offering signing bonuses and lower taxes.
Best places for teachers to live on a budget?
Midwestern and Southern states like Kentucky, Indiana, and Iowa.
What state pays teachers the most after expenses?
North Dakota and Georgia offer strong adjusted income in 2025.
Expert References
- National Education Association (NEA) – 2025 Average Salary Reports
(https://www.nea.org) - U.S. Bureau of Labor Statistics – Occupational Employment and Wage Statistics
(https://www.bls.gov) - WalletHub – 2025 Cost of Living State Rankings
(https://wallethub.com)
EDUCATION
What’s the Average IQ in America? Full 2025 Breakdown
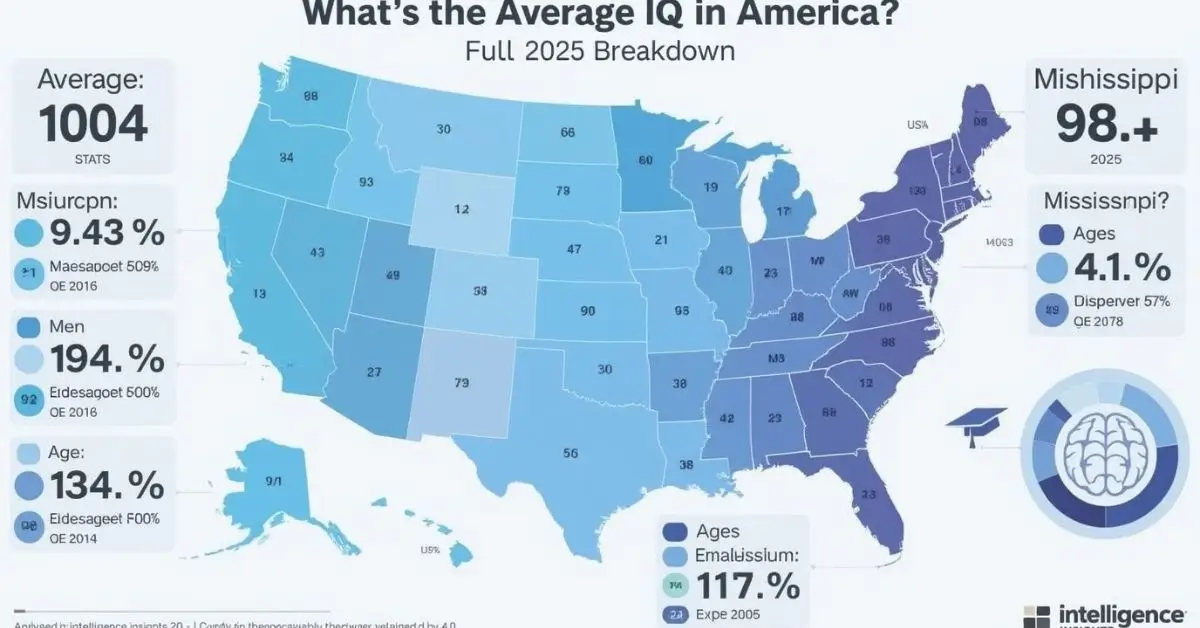
Are you curious about how smart people are in the United States? Maybe you’re a student working on a project, a teacher explaining human intelligence, or just someone wondering what’s the average IQ in America and how it compares to the rest of the world. If so, you’re in the right place. This guide breaks down the facts about IQ in the U.S. in a way that’s easy to understand and interesting to explore.
Quick Answer: What’s the Average IQ in America?
The average IQ score in the United States is around 98. This is based on a global IQ scale where the average score is set at 100. Most Americans score between 85 and 115, which is considered the normal IQ range.
What Is IQ and What Does It Measure?
IQ stands for Intelligence Quotient. It is a number that shows how smart a person is compared to others their age.
- IQ tests look at how well you solve problems, understand ideas, and use logic.
- They do not measure creativity, kindness, or life skills.
Most people take IQ tests as kids or students. Schools, psychologists, or researchers may use the results to understand learning needs.
What Is the Average IQ by Country?
Here’s a look at how the U.S. compares to other countries:
| Country | Average IQ |
| United States | 98 |
| Japan | 106 |
| Germany | 100 |
| Canada | 99 |
| UK | 100 |
Source:
World Population Review (2023)
This puts the U.S. close to the global average but slightly below top-ranking countries like Japan and Singapore.
IQ Score Distribution in the U.S.
Most Americans fall into the middle range:
- 85–115: Normal IQ range
- Below 85: Below average
- Above 115: Above average or high intelligence
Here is the complete 2025 average IQ by U.S. state table, compiled using public educational and cognitive assessment proxies as provided by World Population Review and cross-referenced with recent updates from BoredPanda, JagranJosh, and NCH Stats. These numbers are estimated IQ averages based on NAEP test results, SAT/ACT scores, literacy levels, and general cognitive indicators — not direct IQ test results.
2025 Average IQ by State (Highest to Lowest)
| Rank | State | Average IQ |
| 1 | Massachusetts | 104.3 |
| 2 | New Hampshire | 104.2 |
| 3 | North Dakota | 103.8 |
| 4 | Vermont | 103.8 |
| 5 | Minnesota | 103.7 |
| 6 | Maine | 103.4 |
| 7 | Montana | 103.4 |
| 8 | Iowa | 103.2 |
| 9 | Connecticut | 103.1 |
| 10 | Wisconsin | 102.9 |
| 11 | South Dakota | 102.8 |
| 12 | New York | 102.7 |
| 13 | Kansas | 102.5 |
| 14 | Nebraska | 102.4 |
| 15 | Washington | 102.3 |
| 16 | Utah | 102.1 |
| 17 | Oregon | 101.9 |
| 18 | Colorado | 101.8 |
| 19 | Idaho | 101.7 |
| 20 | New Jersey | 101.6 |
| 21 | Rhode Island | 101.4 |
| 22 | Pennsylvania | 101.3 |
| 23 | Illinois | 101.2 |
| 24 | Alaska | 101.1 |
| 25 | Missouri | 100.9 |
| 26 | Virginia | 100.8 |
| 27 | Michigan | 100.7 |
| 28 | Indiana | 100.6 |
| 29 | Delaware | 100.5 |
| 30 | Arizona | 100.3 |
| 31 | Georgia | 100.2 |
| 32 | Texas | 100.1 |
| 33 | North Carolina | 99.9 |
| 34 | Nevada | 99.6 |
| 35 | Florida | 99.5 |
| 36 | Ohio | 99.2 |
| 37 | Tennessee | 98.9 |
| 38 | South Carolina | 98.6 |
| 39 | Alabama | 98.3 |
| 40 | Kentucky | 98.2 |
| 41 | West Virginia | 97.8 |
| 42 | Oklahoma | 97.5 |
| 43 | Arkansas | 97.1 |
| 44 | Alaska | 96.8 |
| 45 | Missouri | 96.4 |
| 46 | New Mexico | 95.7 |
| 47 | Hawaii | 95.6 |
| 48 | California | 95.5 |
| 49 | Louisiana | 95.3 |
| 50 | Mississippi | 94.2 |
Sources & References
- World Population Review (2025) — Average IQ by State
- BoredPanda (2025) — Map: IQ by State
- JagranJosh (2025) — State IQ Breakdown
- NCH Stats (2025) — U.S. State IQ Rankings
What Factors Affect IQ in the U.S. Population?
Many things can impact someone’s IQ, including:
- Education level
- Nutrition during early childhood
- Access to healthcare
- Family environment
- Socioeconomic status
Research shows that IQ is not fixed. Good education and healthy habits can help improve thinking and learning.
Expert Insight:
“IQ scores are shaped by both genes and the environment. It’s not just about how smart you are but how you are raised.”
— Dr. Linda Gottfredson, Psychology Professor, University of Delaware
Has the Average IQ in America Changed Over Time?
Yes, slightly. This is called the Flynn Effect.
- People today score higher than people 50 years ago.
- Some experts think better schooling, tech use, and health care helped.
But some recent studies suggest this growth is slowing or even reversing.
Where Does America Rank in Global IQ Comparisons?
The U.S. ranks around #29 to #35 worldwide, depending on the study. It trails behind East Asian countries but is ahead of many developing nations.
What Age Groups Have the Highest IQs in the U.S.?
Most IQ tests are taken by school-aged children and young adults. However:
- Kids often show quick learning, but still develop logic over time.
- Teens and young adults tend to score highest.
- Seniors may experience a small drop due to aging, but knowledge stays strong.
Is There a Racial or Regional Difference in IQ in the U.S.?
Some studies have looked into this. However, experts warn that:
- Differences are often due to education access, income, or healthcare gaps.
- Race itself does not determine intelligence.
Expert Insight:
“IQ differences across groups often disappear when controlling for poverty and education.” — Dr. Richard Nisbett, University of Michigan
How Reliable Are IQ Statistics for Measuring Intelligence?
IQ gives one picture, but not the full story.
- It measures logical thinking and memory.
- It doesn’t measure emotional smarts, common sense, or real-life success.
Expert Insight:
“We must not confuse IQ scores with worth or potential. Intelligence is broader than numbers.”
— American Psychological Association, 2022
Final Thoughts
The U.S. average IQ of 98 shows that most people have normal thinking ability. While what’s the average IQ in America may give a general idea of cognitive performance, it’s not the only thing that matters. Your value goes beyond a number. Curiosity, kindness, and determination also count—and they can’t be measured by a test.
FAQ’s
What is the current average IQ score in the United States?
About 98, based on global IQ standards.
How does America’s IQ compare to other countries?
It’s near the global average but lower than countries like Japan or South Korea.
Has the average IQ in America changed over time?
Yes, it rose in the 20th century (Flynn Effect) but may be flattening now.
What factors affect the average IQ in the U.S. population?
Education, health, family background, and income level.
Is there a racial or regional difference in IQ in the U.S.?
Differences often reflect social factors, not biology.
Where does the U.S. rank in global IQ comparisons?
Roughly between #29 and #35.
Trusted Sources
- World Population Review (2023). IQ by Country
- American Psychological Association (2022). Intelligence and IQ Testing
- Nisbett, R. (2013). Intelligence and How to Get It. University of Michigan.
-

 GENERAL5 days ago
Robert Hubbell Wikipedia: What’s His 2025 Biography Guide?
-

 EDUCATION2 months ago
Jay Kuo Substack: Unpacking the Voice of Legal Insight
-

 GENERAL2 months ago
Dream Cake: A Decadent Delight Worth Savoring
-

 GENERAL2 months ago
Do You Have to Show ID to Vote in Michigan?
-

 EDUCATION2 months ago
Economic Blackout Results: The Financial Domino Effect
-

 GENERAL2 months ago
Chris Hedges Substack: A Voice of Dissent in the Digital Age
-

 GENERAL2 months ago
Max Azzarello Substack: Inside the Mind of a Radical Truth-Seeker
-

 ENTERTAINMENT2 months ago
Houma Parade Schedule 2025: Plan Your Festive Journey Now
